 GOVERNMENT OF INDIA
Impact Of Relationship With China And Partner Country On Corona Cases
The impact of corona virus has been uneven across several countries. Contrary to the common notion that developing and less developed countries that are geographically closer to china will see more rise in cases, the emerging evidence indicates a high rise in cases particularly from the developed world which are geographically far off from China. As on 22nd April 2020, overall 0.8 million cases reported from the USA and over 140, 000 case each reported from Spain, Italy, France & Germany. The number of cases in these countries now far exceed China, which reports overall cases of 82,788 where the virus originated. WHO declared COVID 2019 as global pandemic and called for a united fight to defeat the virus. As on 22nd April 2020, COVID cases reported from over 210 countries across the globe. The number of cases may be much higher than the actual reported due to low testing rates in many countries.
The established transmission route for transmission of the corona is being in close contact with corona positive person where there is a high probability of droplet exchange from talking, coughing, and sneezing from an infected person. The recent evidence also indicates asymptomatic transfer wherein infected individuals will spread the disease even before symptoms appear. To curb the spread of infection, the chinese government has imposed severe restrictions in Wuhan, the city in China from where the virus originated. The severe restrictions included a travel ban that lasted for almost 76 days. Despite such restrictions, the virus however now touches far corners of the globe. The countries across the world are critiquing China for its failure to contain the spread of the virus[1]. However, what is bewildering in the corona infections across the world is that number of cases reported from situated far-off countries from China are much larger than close countries such as Vietnam, Singapore, South Korea & Japan despite the considerable strong connection between China & these countries.
It is in this context, the research undertaken investigates the relation between China and partner country on a number of corona cases reported. The relation between China and the partner country is assessed using a bilateral trade variable, which is calculated as the sum of imports and exports with China. Trade is a proxy variable for indicating the strength of the connection between China and partner country. If the arguments made by many that Chinese connection is responsible for a sharp rise in cases, then we expect a strong relation between bilateral trade variable and number of cases. The econometric model tested by the research is indicated below:

The outcome variable Y in the above model is the number of corona cases reported from each partnering country. To control for the argument that the number of positive cases are underreported in many countries and the scale of testing is small, the outcome variable is measured as a number of positive cases on the total tested. Bilateral trade is the sum of exports between partner country and China. The trade data of 2018 is used to assess the above relation to avoid the reverse casualty as a spike in the number of corona cases may also lead to reduced trade. However, trade relation in 2018 only signifies the strength of the relation between the partner country and china and has no relation to the number of corona cases that are reported today. In the above econometric model, ‘c’ indexes for partner country and ‘t’ for time.
The key outcome variable and trade variable are log-transformed to reduce the outlier effect. The examination of the relation between cases and trade through scatterplot as demonstrated in Figure-1, confirms our hypothesis that Vietnam and Hongkong particularly reported lower cases compared to the USA for similar trade levels. The relation between bilateral trade with China and corona cases across the world seems to be positively related.
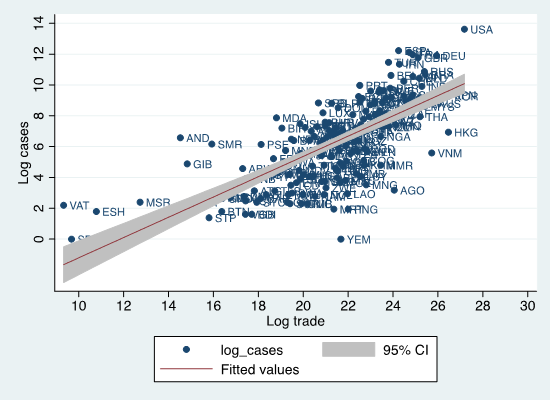
Figure-1: Scatterplot of Log cases vs log trade
The analysis of group of countries which reported over 10,000 cases as on 21 April,2020, highlights that South Korea and Japan reported fewer cases compared to USA for comparable bilateral trade with China. On other hand, despite strong trade relationship between China and major south east Asian economies such as Vietnam, Hong Kong & Laos as indicated by trade variable, the no. of corona cases are less than 5,000 in these countries.
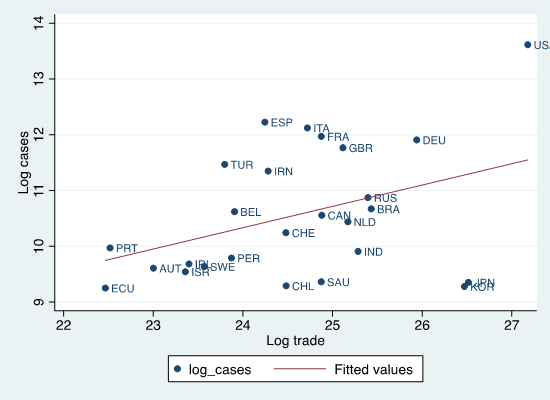
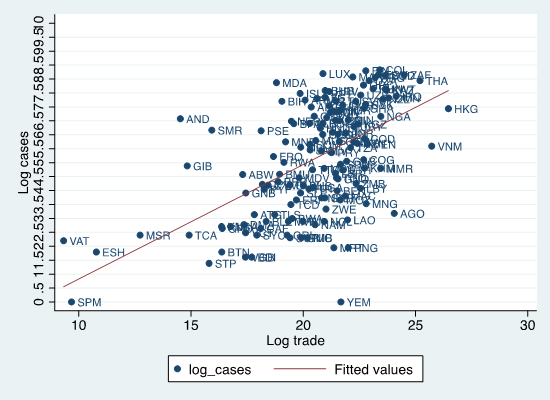
Figure-2: Scatter plot of Log cases and Log trade
Table-1 summary reveals that Japan, South Korea and Hong Kong trade values are just half the USA total trade value however the corona case volumes on other hand are less than 1% of the cases reported in USA. Also, Vietnam, India, Thailand and Singapore trade more with China compared to France, Italy, Spain and UK where the case volumes are higher compared to these countries. This analysis points to a weak relationship between trade and corona case volume.
|
Country |
Bilateral trade with China in 2018 |
Total cases as on 22nd April |
% trade of US value |
% cases on total US volume |
|---|---|---|---|---|
|
United States |
635706 |
819164 |
|
|
|
Japan |
327637 |
11512 |
52% |
1% |
|
South Korea |
313595 |
10694 |
49% |
1% |
|
Hong Kong |
311521 |
1030 |
49% |
0% |
|
Germany |
184166 |
148453 |
29% |
18% |
|
Vietnam |
148103 |
268 |
23% |
0% |
|
India |
95731 |
20080 |
15% |
2% |
|
Thailand |
87893 |
2811 |
14% |
0% |
|
Singapore |
83456 |
9125 |
13% |
1% |
|
United Kingdom |
80881 |
129044 |
13% |
16% |
|
Indonesia |
77401 |
7135 |
12% |
1% |
|
France |
63523 |
158050 |
10% |
19% |
|
Philippines |
55707 |
6599 |
9% |
1% |
|
Italy |
54418 |
183957 |
9% |
22% |
|
Iran |
35108 |
84802 |
6% |
10% |
|
Spain |
33851 |
204178 |
5% |
25% |
|
Pakistan |
19147 |
9565 |
3% |
1% |
|
Mongolia |
7988 |
34 |
1% |
0% |
|
Laos |
3485 |
19 |
1% |
0% |
Table-1: Summary of trade and corona cases
To buttress the argument of weak relationship between trade and corona cases, the research examines the impact of trade on corona cases (See Table-2), through regression. As expected, the regression results reveals that there is no strong relation between bilateral trade and no. of corona cases reported in each partnering country. This indicates that countries strong relation with China is not a reason for a strong rise in cases. This may also be the reason Vietnam, Hong Kong and South East Asian economies do not see such major rise in cases. Also, the arguments that larger countries will report more cases is controlled by using population as a control variable. The research still does not find any strong relation between bilateral trade and number of corona cases.
Table-1: Regression analysis of Log total cases in the country on bilateral trade
|
VARIABLES |
(1) log_cases_per_tested |
(2) log_cases_per_tested |
|---|---|---|
|
|
|
|
|
log_trade |
-0.021 |
-0.017 |
|
(0.041) |
(0.075) |
|
|
log_pop |
0.010 |
|
|
(0.079) |
||
|
Constant |
-2.556*** |
-2.806*** |
|
(0.886) |
(0.918) |
|
|
Observations |
156 |
154 |
|
R-squared |
0.002 |
0.001 |
|
Robust standard errors in parentheses |
||
|
*** p<0.01, ** p<0.05, * p<0.1 |
||
To investigate what drives the corona cases across the world, the research looks at global hotspots map (see Figure-2). This reveals that a large number of hotspots are concentrated in 30-60 degree latitude in Northern hemisphere. The research therefore also includes latitude and longitude in the regression analysis and finds that both latitude and longitude are significant. Being in the same latitude as China has positive effect on the number of cases while in the same longitude has a negative effect.

Source: John Hopkins Corona Map dashboard as on 14th April, 2020
To further analyse why latitude is driving positive cases, the model also tests for having the same temperature as China and its influence on number of cases. This is primarily to assess whether countries experiencing same temperature as China are more prone to infections. The revised econometric model with latitude, longitude and temperature is indicated below:

Temperature is modelled as the inverse of square of an average temperature difference between China and partner country i.e. 1/(Average Feb temperature in China – Average Feb temperature in partner country)2. Average January and February temperature of 2014, 2015 and 2016 is used for the analysis to avoid the impact of extreme changes in one year. The variable is modelled as an inverse square with the idea that the higher the value of a variable (having small temperature change with China), higher will be the cases. See Table-2 for regression results.
Table-2: Regression analysis of Log total cases in the country on bilateral trade including temperature
|
VARIABLES |
(1) log_cases_per_tested |
(2) log_cases_per_tested |
(3) log_cases_per_tested |
(4) log_cases_per_tested |
|
|---|---|---|---|---|---|
|
|
|
|
|
|
|
|
log_trade |
-0.021 |
-0.017 |
0.006 |
0.063 |
|
|
(0.041) |
(0.075) |
(0.072) |
(0.090) |
||
|
log_pop |
0.010 |
0.059 |
0.070 |
||
|
(0.079) |
(0.072) |
(0.085) |
|||
|
lat |
0.008*** |
0.007** |
|||
|
(0.003) |
(0.003) |
||||
|
lon |
-0.008*** |
-0.008*** |
|||
|
(0.002) |
(0.002) |
||||
|
month_jan_diff_inverse |
0.078 |
||||
|
(0.564) |
|||||
|
month_feb_diff_inverse |
0.010 |
||||
|
(0.009) |
|||||
|
Constant |
-2.556*** |
-2.806*** |
-4.162*** |
-5.576*** |
|
|
(0.886) |
(0.918) |
(0.949) |
(1.302) |
||
|
Observations |
156 |
154 |
154 |
134 |
|
|
R-squared |
0.002 |
0.001 |
0.166 |
0.179 |
|
|
Robust standard errors in parentheses |
|
||||
|
*** p<0.01, ** p<0.05, * p<0.1 |
|||||
The results reveal that there is no influence of temperature on the number of cases. This dismisses the arguments that countries with same climate as China are the ones experiencing high cases. The answer to the puzzle on a high number of cases in the developed world compared to the developing world may lie in the speed at which control measures are implemented by developing countries. India is the first country in the world to impose a nation-wide lockdown from March 25 and now extended it till May 3, 2020[2]. Vietnam instituted lockdown as early as February 12, 2020 in the province near Hanoi and carried complete tracing of people who encountered infected person[3]. Oxford stringency index which measures government response to COVID by institutionalizing several containment measures rates both India and Vietnam very high in stringency response. Both countries score 100 on stringency measures[4]. The data on 13 indicators such as travel bans, school closures, public transport closures, restrictions on the outside and within the country movement, testing policies and contact tracing is aggregated to calculate stringency index[5]. The average of stringency values across several dates in various continents is summarized in the table-3 below. The analysis reveals that Asian countries are leading the way in terms of institutionalized quarantine measures much faster than European and North American countries.
Table-3: Average Stringency Index
|
Continent |
Feb 10, 2020 |
Mar 10, 2020 |
Apr 10, 2020 |
|---|---|---|---|
|
Africa |
3.64147 |
8.193529 |
73.33334 |
|
Asia |
23.17882 |
41.83628 |
85.49727 |
|
Europe |
6.032333 |
30.08 |
83.332 |
|
North America |
8.96353 |
19.46824 |
72.44714 |
|
Oceania |
23.81 |
28.57 |
80.95 |
|
South America |
4.33 |
13.85455 |
79.93285 |
The analysis in Figure-3 reveals that major Asian countries have been dynamic and instituted stringency measures as early as Week#4 since the first recorded case while the stringency measures in developed nations such as UK, USA, France, Germany and Spain are delayed by 1-2 weeks compared to the developing nations.


Figure-3: Change in stringency score over the weeks
Regression analysis of stringency measures however need to acknowledge the reverse casualty wherein country’s may have upgraded stringency responses as a result of increasing cases. The research acknowledges such a possibility and uses bilateral trade in 2018 as an instrumental variable. Trade in 2018 is exogenous as it has no impact on corona cases today. Secondly, countries with strong Chinese connections may have increased stringency measures in advance. Therefore, the use of bilateral trade in 2018 will serve as a valid instrument in this context. Using trade as an IV instrument, the regression analysis results in Table-3 reveals that stringency has negative effect on total cases. The increase in stringency score by 1% will decrease the total cases by almost 4%.
Table-3: Regression analysis of Log total cases in the country on stringency measures
|
VARIABLES |
(1) log_tot_cases |
(2) log_tot_cases |
(3) log_tot_cases |
(4) log_tot_cases |
|---|---|---|---|---|
|
|
|
|
|
|
|
log_stringency |
2.079*** |
2.232*** |
2.420*** |
-4.065*** |
|
(0.041) |
(0.043) |
(0.042) |
(0.468) |
|
|
log_pop |
0.370*** |
0.434*** |
0.028 |
|
|
(0.016) |
(0.015) |
(0.046) |
||
|
lat |
0.034*** |
0.006* |
||
|
(0.001) |
(0.003) |
|||
|
lon |
-0.004*** |
-0.002** |
||
|
(0.000) |
(0.001) |
|||
|
Constant |
-3.500*** |
-10.198*** |
-12.714*** |
20.589*** |
|
(0.162) |
(0.347) |
(0.343) |
(2.473) |
|
|
Observations |
5,799 |
5,568 |
5,568 |
5,568 |
|
R-squared |
0.269 |
0.328 |
0.422 |
|
|
Robust standard errors in parentheses |
||||
|
*** p<0.01, ** p<0.05, * p<0.1 |
||||
The research concludes that rise in cases in Europe and North America is not driven by a connection to China but the alacrity of government containment measures. Secondly, the reasons find no evidence that places with the same temperature as China are more possibly the one’s to see a rise in cases. The research finds that speed at which containment measures instituted by developing nations are responsible for explaining the difference in corona cases across the globe.
The emergence of Corona is proving that governments in the developing world have in-built capacities to tackle such pandemic while developed countries continue to falter. 21st century is proving to be an Asian century as China, India and other countries in Asia are showing the way forward to the world. The successful containment measures however have come at economic cost especially in the developing world. The governments should therefore take pro-active measures to launch mitigative steps to lessen the impact on poor.
Remarks: Data sources used for the analysis include: Corona & Population data from Worldometer, Temperature data from World Bank Climate Data API, Trade data from COMTRADE database of WTO, Latitude and longitude data from Google developers and Strigency data from Oxford.
*Venugopal Mothkoor is Monitoring and Evaluation Specialist, DMEO. Views expressed are personal.
[1] https://www.atlanticcouncil.org/blogs/new-atlanticist/is-china-winning-the-coronavirus-response-narrative-in-the-eu/
[2]https://www.aljazeera.com/news/2020/04/india-nationwide-coronavirus-lockdown-extended-3-modi-200414045543730.html
[3] https://www.dw.com/en/how-vietnam-is-winning-its-war-on-coronavirus/a-52929967
[4] https://www.thestar.com.my/news/nation/2020/04/12/malaysia039s-response-to-covid-19-ranked-fourth-strictest-in-sea
[5] https://www.bsg.ox.ac.uk/research/research-projects/oxford-covid-19-government-response-tracker